Parts of Power BI
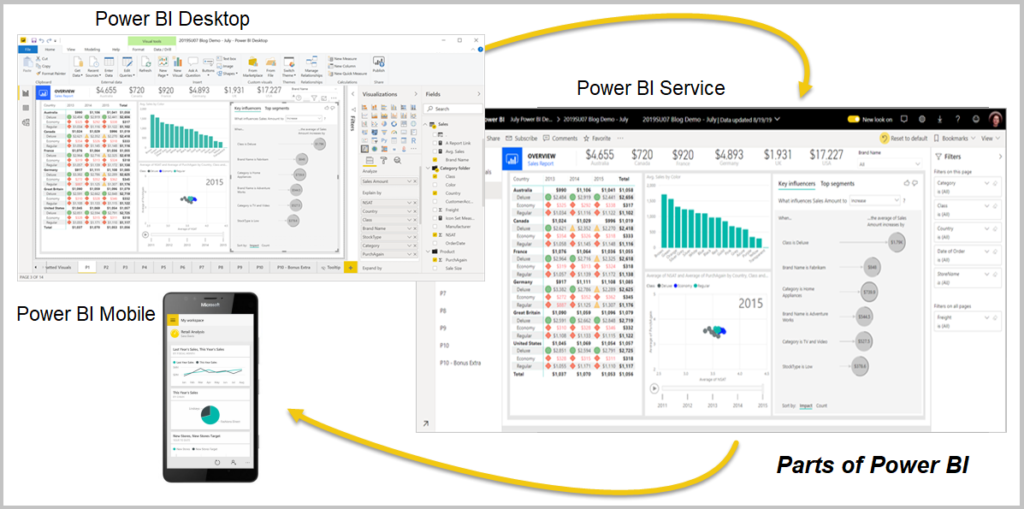
There are three parts of Power BI which work together to provide a seamless experience.
- Power BI Desktop: Power BI Desktop is a desktop application that we installed in last chapter. This desktop application will be used by Power BI developer to develop the data models and create visualizations. These visualizations are then published on Power BI Service for end users to consume.
- Power BI Service: This is a online Power BI Server, software as a service(Saas). Once developer publishes the report, it can be consumed using Power BI service. The end user can interact with visuals, change filters and analyze the data. The users of this service will be mostly higher management where they can present the reports in meetings and take important business decisions.
- Power BI Mobile (Android and IOS): There are apps available for both Android and IOS platforms. All Reports published on Power BI server can used from mobile devices also.
Power BI Interface
Power BI Desktop is a desktop application developers use to develop models and design dashboards.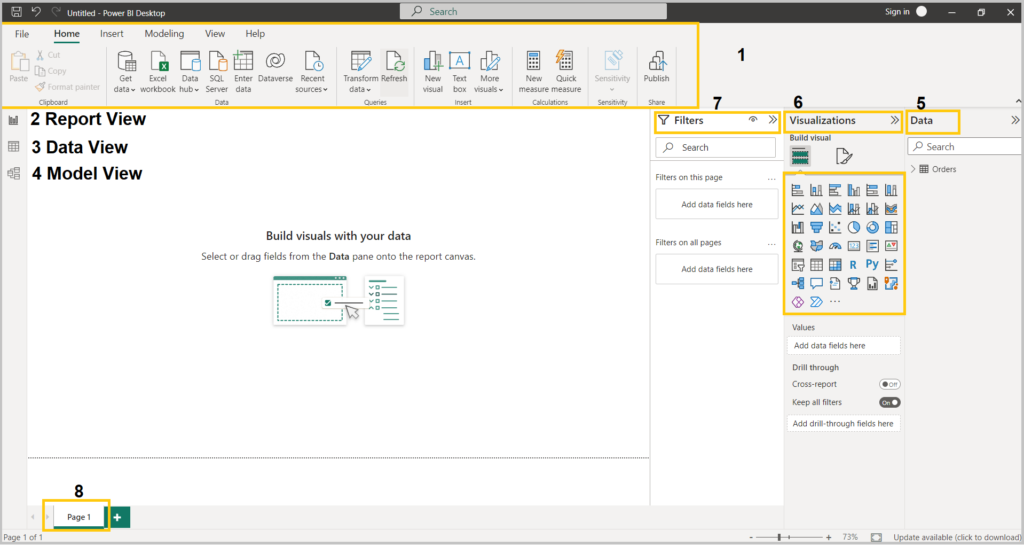
- Ribbon: Ribbon has all the important options to configure or edit your dashboard.
- Report View: Report view is the canvas to build visualizations.
- Data View: Data View shows the data from data sources. You can review and make some edits in the data.
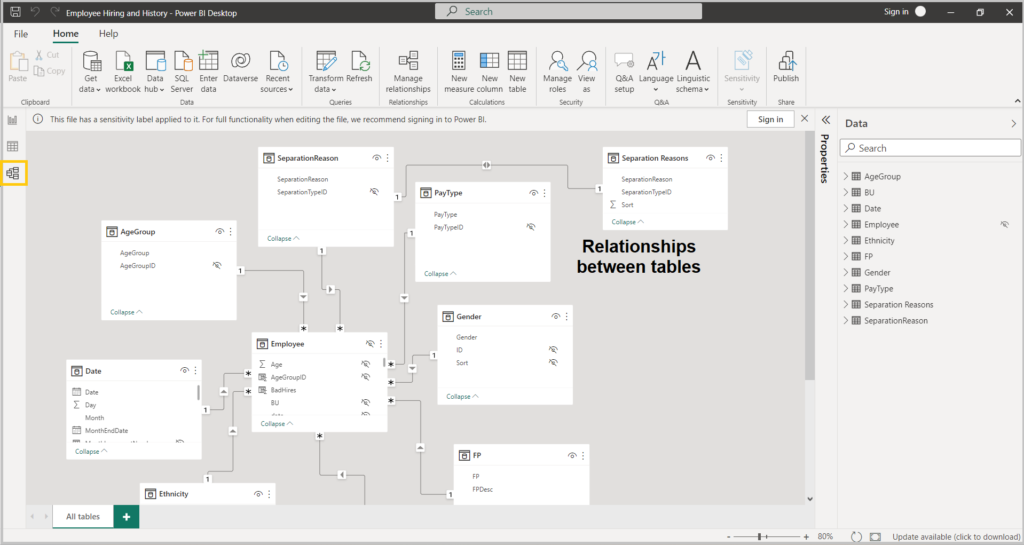
- Model View: This View shows the model of the dashboard. You can see and create relationships between the tables.
- Data Pane: This Pane shows all the tables used in the dashboard. You can pull the required fields from these tables to create the required visualization.
- Visualization: This Pane has different types of visuals ready to drag and drop on the canvas.
- Filters: You can apply filters on current specific Visual, current page or on all pages.
Flow of Power BI Report Development
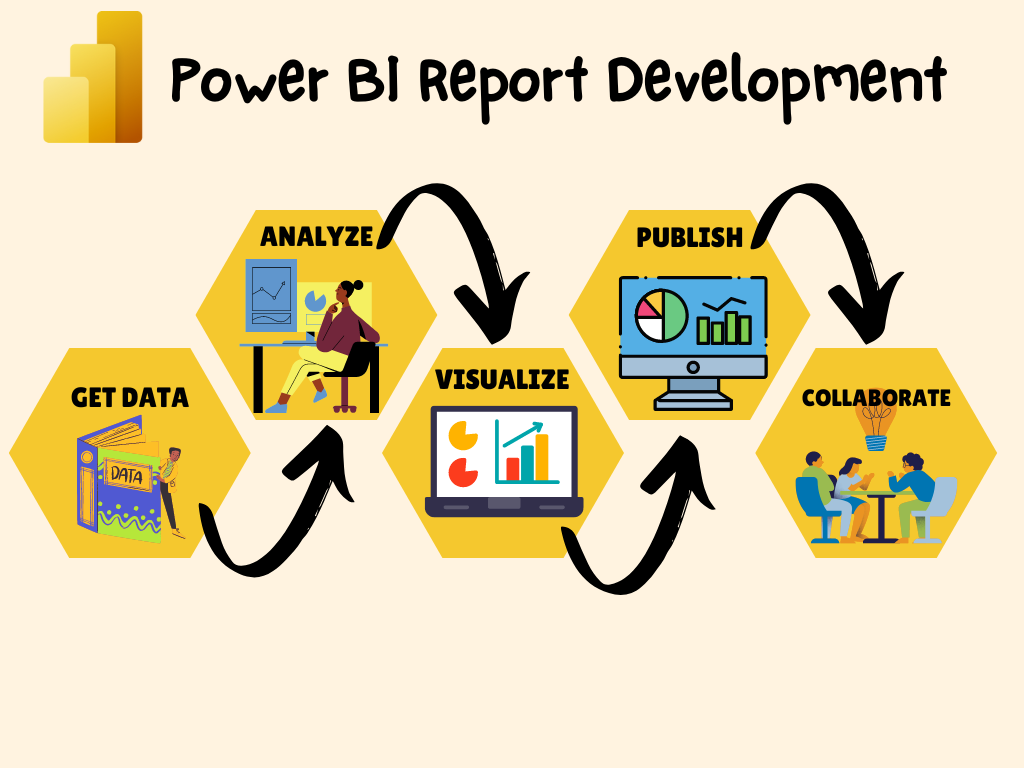
Typically Power BI Report development involves 5 steps as below:
- Get Data: Connect and get data from both on-premise or cloud data source.
- Analyze Data: Shape, Transform and Clean data. Data models are automatically created using high performance in memory Data engine.
- Visualize: Create visuals/graphs from cleaned data.
- Publish: Publish the report to Power BI service and you can schedule the refresh so your report will always have the latest data.
- Collaborate: Collaborate with colleagues to make necessary changes and implement feedback. And this cycle will continue.
Power BI Components
There are 4 components of Power BI. Click on each tab to learn more.
Power Query
Power Pivote
Power View
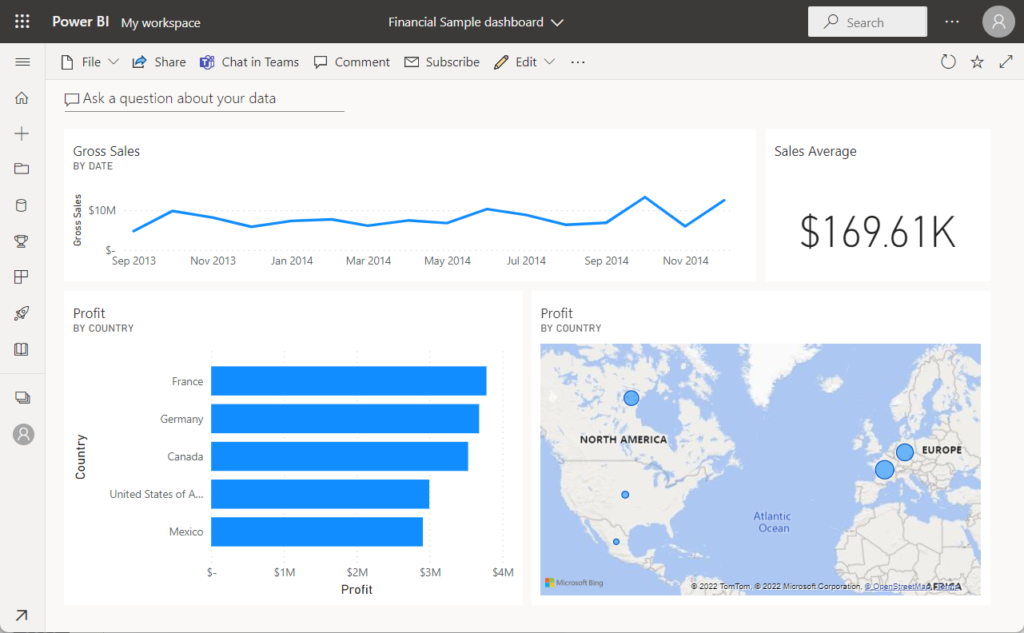
Power BI Service
Power Query is the data connectivity and data preparation technology that enables end users to seamlessly import and reshape data from within a wide range of Microsoft products, including Excel, Power BI, Analysis Services, Dataverse, and more.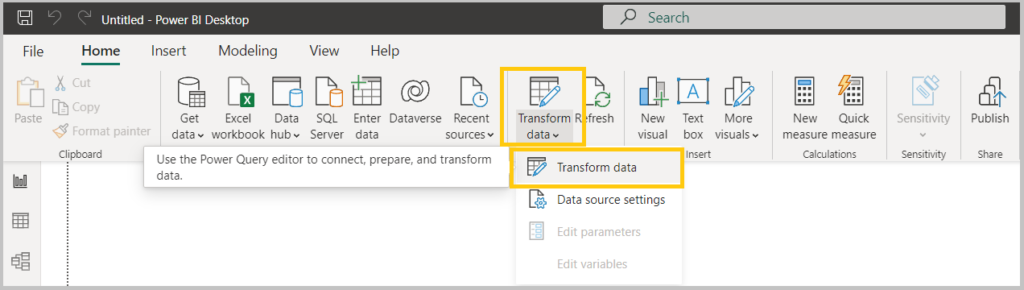
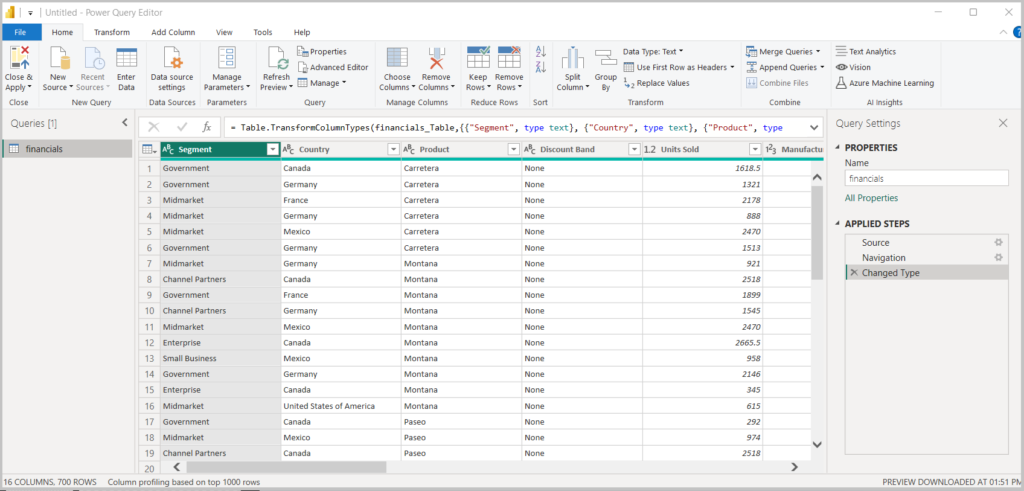 We will looking into each transformation option in next chapters.
Power Pivote will create Models from data imported and create relationships based on it. With it you can create relationships and create large complex models.
Power View is Report View where all the charts and graphs are plotted. It lets you create interactive charts, graphs, maps, and other visuals that bring your data to life. Power View is available in Excel, in SharePoint, SQL Server, and Power BI.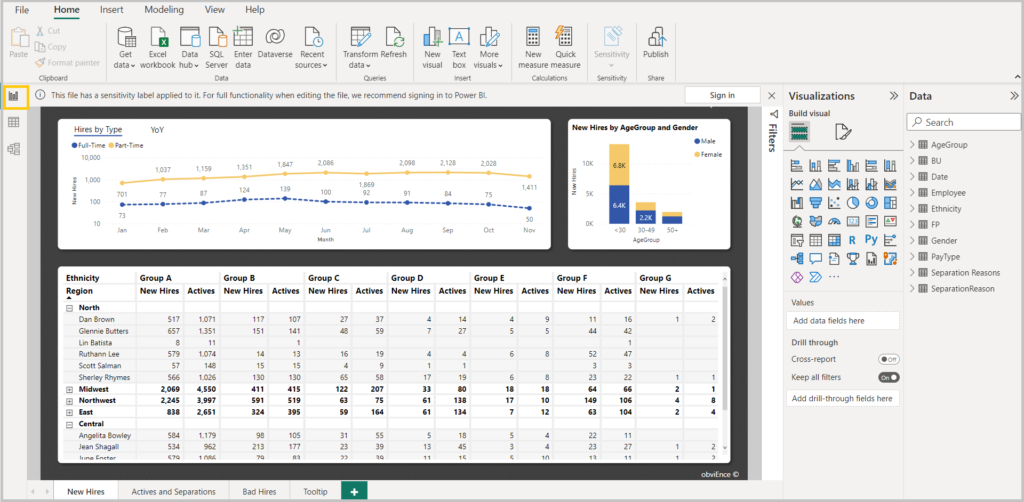
This is a online Power BI Server, software as a service(Saas). After development the reports are published on Power BI service to be consumed by larger audience.
We will be deep diving and understand each topic in upcoming chapters.