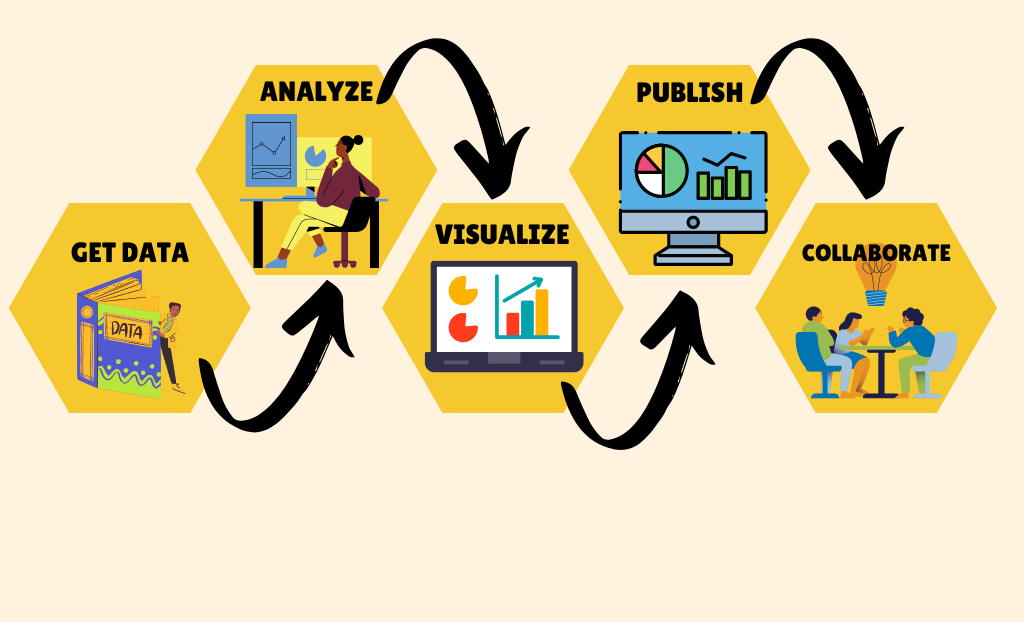
Let’s create our first visual in Power BI. Very first step to start is get data into Power BI.
You need a good meaningful data source to practice and analyze. Below are some places to get a good data source to practice.
Dataset sources
- Kaggle.com is a good place to get many sample datasets from different domains, industries to work on.
- You can get open government data sources from many countries. e.g. for India you can check data.gov.in/
- Or you can get data from sample data sources of Power BI.
First Visual
Follow the steps as below to create your first visual.
We will use data source from Power BI for this demo. Import the “Financials” data source as below.
Once the data is imported you can see the data fields in Data Pane to right or check the complete data for any data issues in Data View to the left.
To create your first visual there are 2 ways.
- You can select the fields directly and the view will create automatically.
If you selected the measure first and then dimension then it will automatically create a chart. However if you selected dimension first and then measure then it will create a simple table with values as shown below. Of-course you can change the visual after as per your requirements. To change the visual type simply change the visual type from visualization.

2. Second way to create a visual is to select the visual first from Visualization pane and then you can drag the required fields to the visual.
Focus Mode in Visual
There is a focus mode for each visual. Focus mode is used when your are working on any visual and want to focus only on it and see it in full view. It will remove all other visualizations from the report temporarily.
This can also be used when presenting a particular visual.